Creating an Example of Power BI Dashboard
Navigating the Complex Terrain of Power BI Dashboards: A Close-up on Business Intelligence Displays with Examples
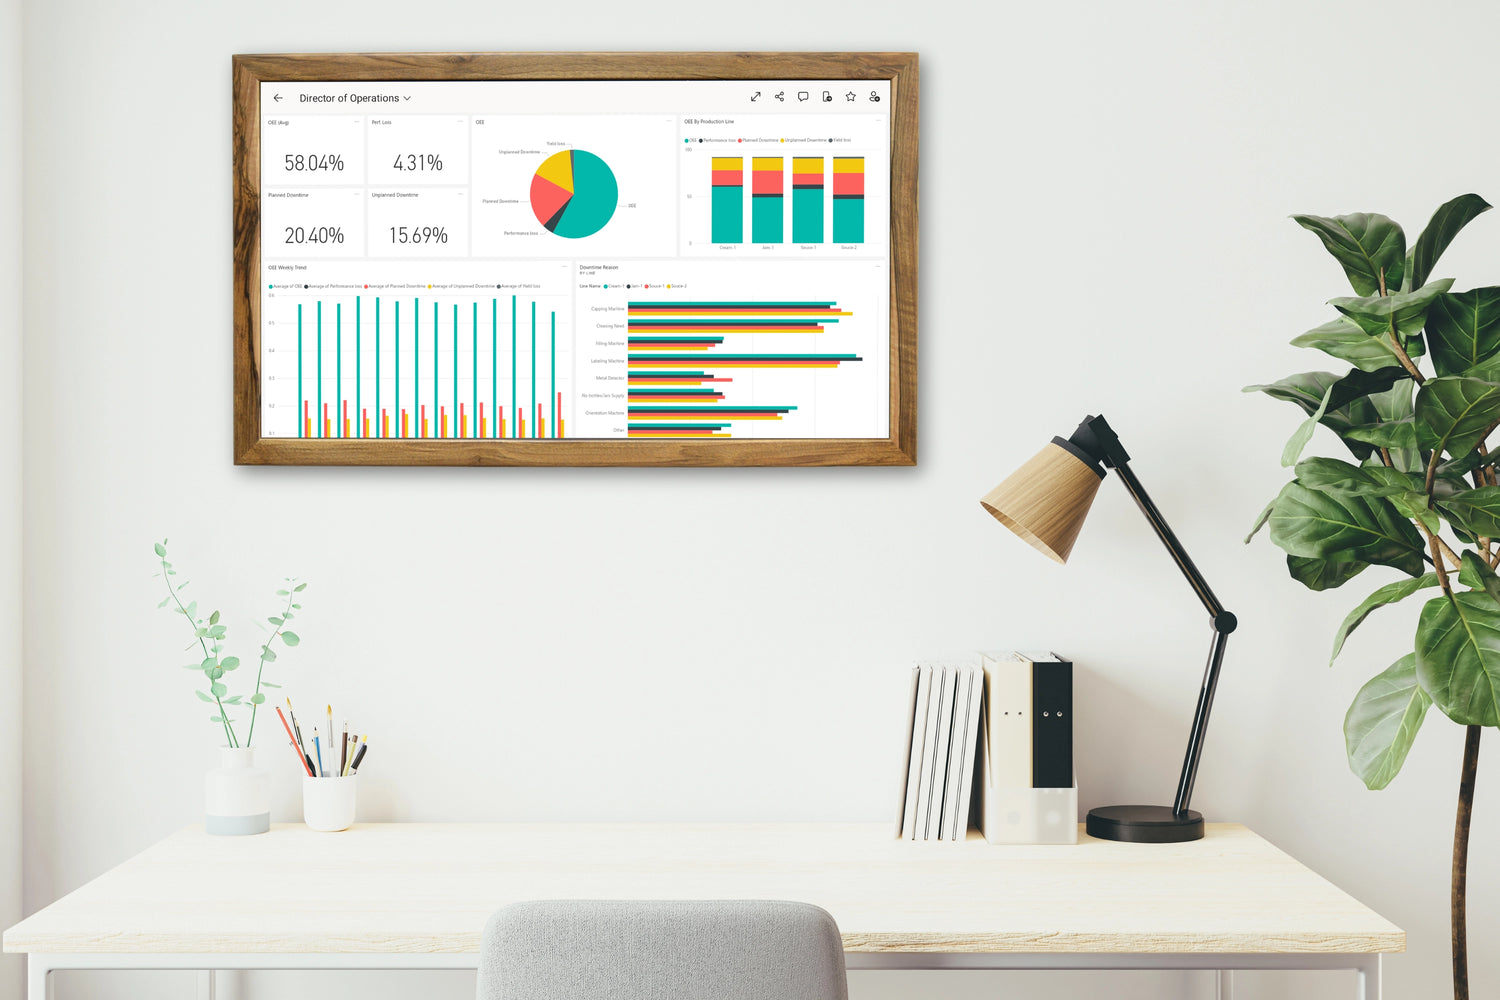
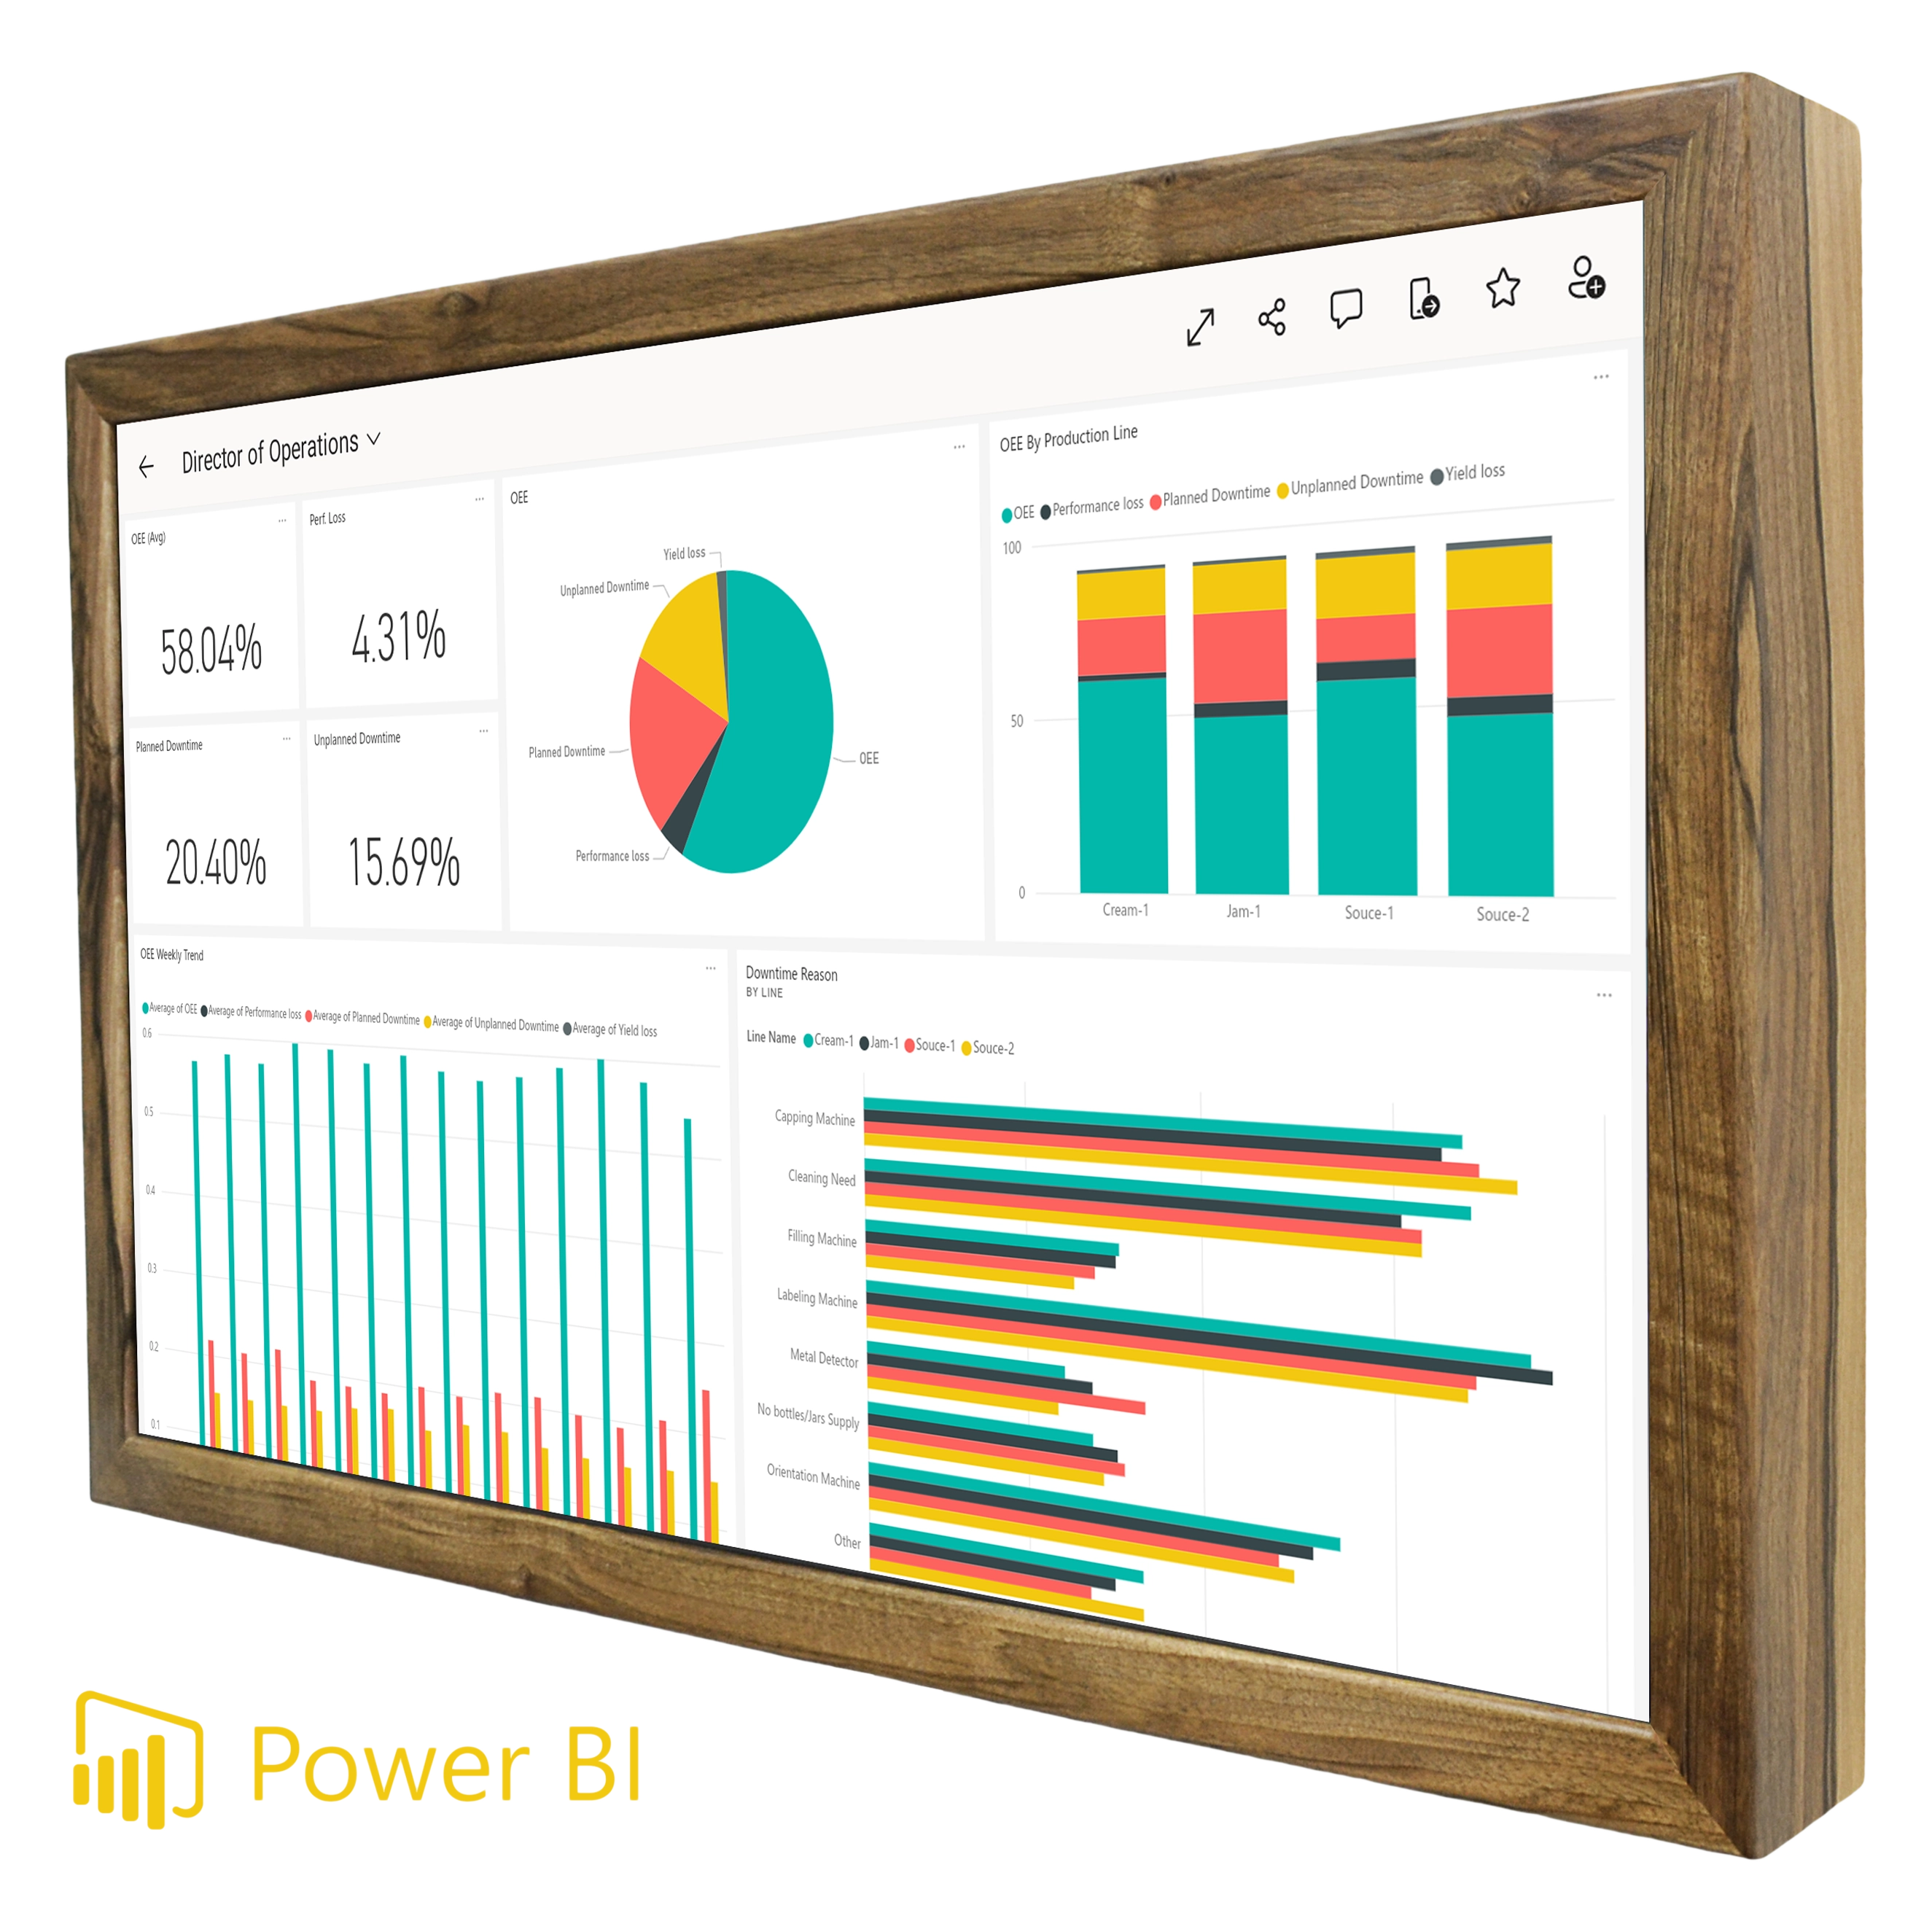
In the world of business intelligence (BI), data visualization is not just a buzzword—it’s the backbone of decision-making processes. As a leading business intelligence tool, the Microsoft Power BI dashboard exemplifies this by offering capabilities to design visually appealing and customizable dashboards, integrate deeply with various data sources, provide a quick overview of essential metrics, and offer advanced features for data transformation and collaboration. Today, I’m diving into the advanced world of Power BI dashboards, specifically through the lens of smart wall displays. This isn't your typical tech talk, it's a deep dive into how a 24-inch touchscreen Business Intelligence Display, powered by Android, is changing the way we interact with and understand data.
A Brief Overview of Power BI
Before we get into the details of dashboards, let’s first understand what Power BI is and why it has become such a powerful tool in the world of business intelligence. In simplest terms, Power BI (Business Intelligence) is a suite of business analytics tools that allows organizations to visualize data and share insights across their entire organization. It enables users to connect with a wide range of data sources, create interactive reports and Microsoft Power BI dashboards, and share them with colleagues or clients. Power BI is a cloud-based service, meaning that users can access their dashboards and reports from anywhere with an internet connection.
Power BI dashboard examples showcase professionally designed analytics dashboards, demonstrating the use of Power BI for various purposes across industries, such as sales, marketing, finance, and human resources. These examples illustrate the versatility and capabilities of Power BI in creating compelling interactive reports and dashboards.
The Importance of Data Visualization
Data visualization is the graphical representation of information and data to help users understand complex concepts or identify patterns and trends. In the context of business intelligence, data visualization plays a crucial role in helping organizations make sense of large datasets and make informed decisions. It allows users to quickly identify key insights, spot trends, and reveal patterns that may otherwise go unnoticed in traditional data formats such as spreadsheets or reports. Incorporating key performance indicators (KPIs) into these visualizations further enhances their utility by providing actionable insights and facilitating data-driven decision-making across various domains, including financial analytics, healthcare, and sales performance.
The Rise of Dashboard Intelligence
First things first, Power BI has emerged as a frontrunner in the BI space, not merely for its comprehensive analytics capabilities but for its flexibility in dashboard creation. It’s not every day you stumble upon a tool that offers both depth and accessibility, managing to strike a delicate balance between being a powerhouse of information and user-friendly. However, as anyone who’s dabbled in Power BI could tell you, creating an effective dashboard isn’t a walk in the park. A power bi dashboard example can demonstrate how Power BI reports excel in presenting sales metrics, football data, or even YouTube analytics with clarity and interactivity.
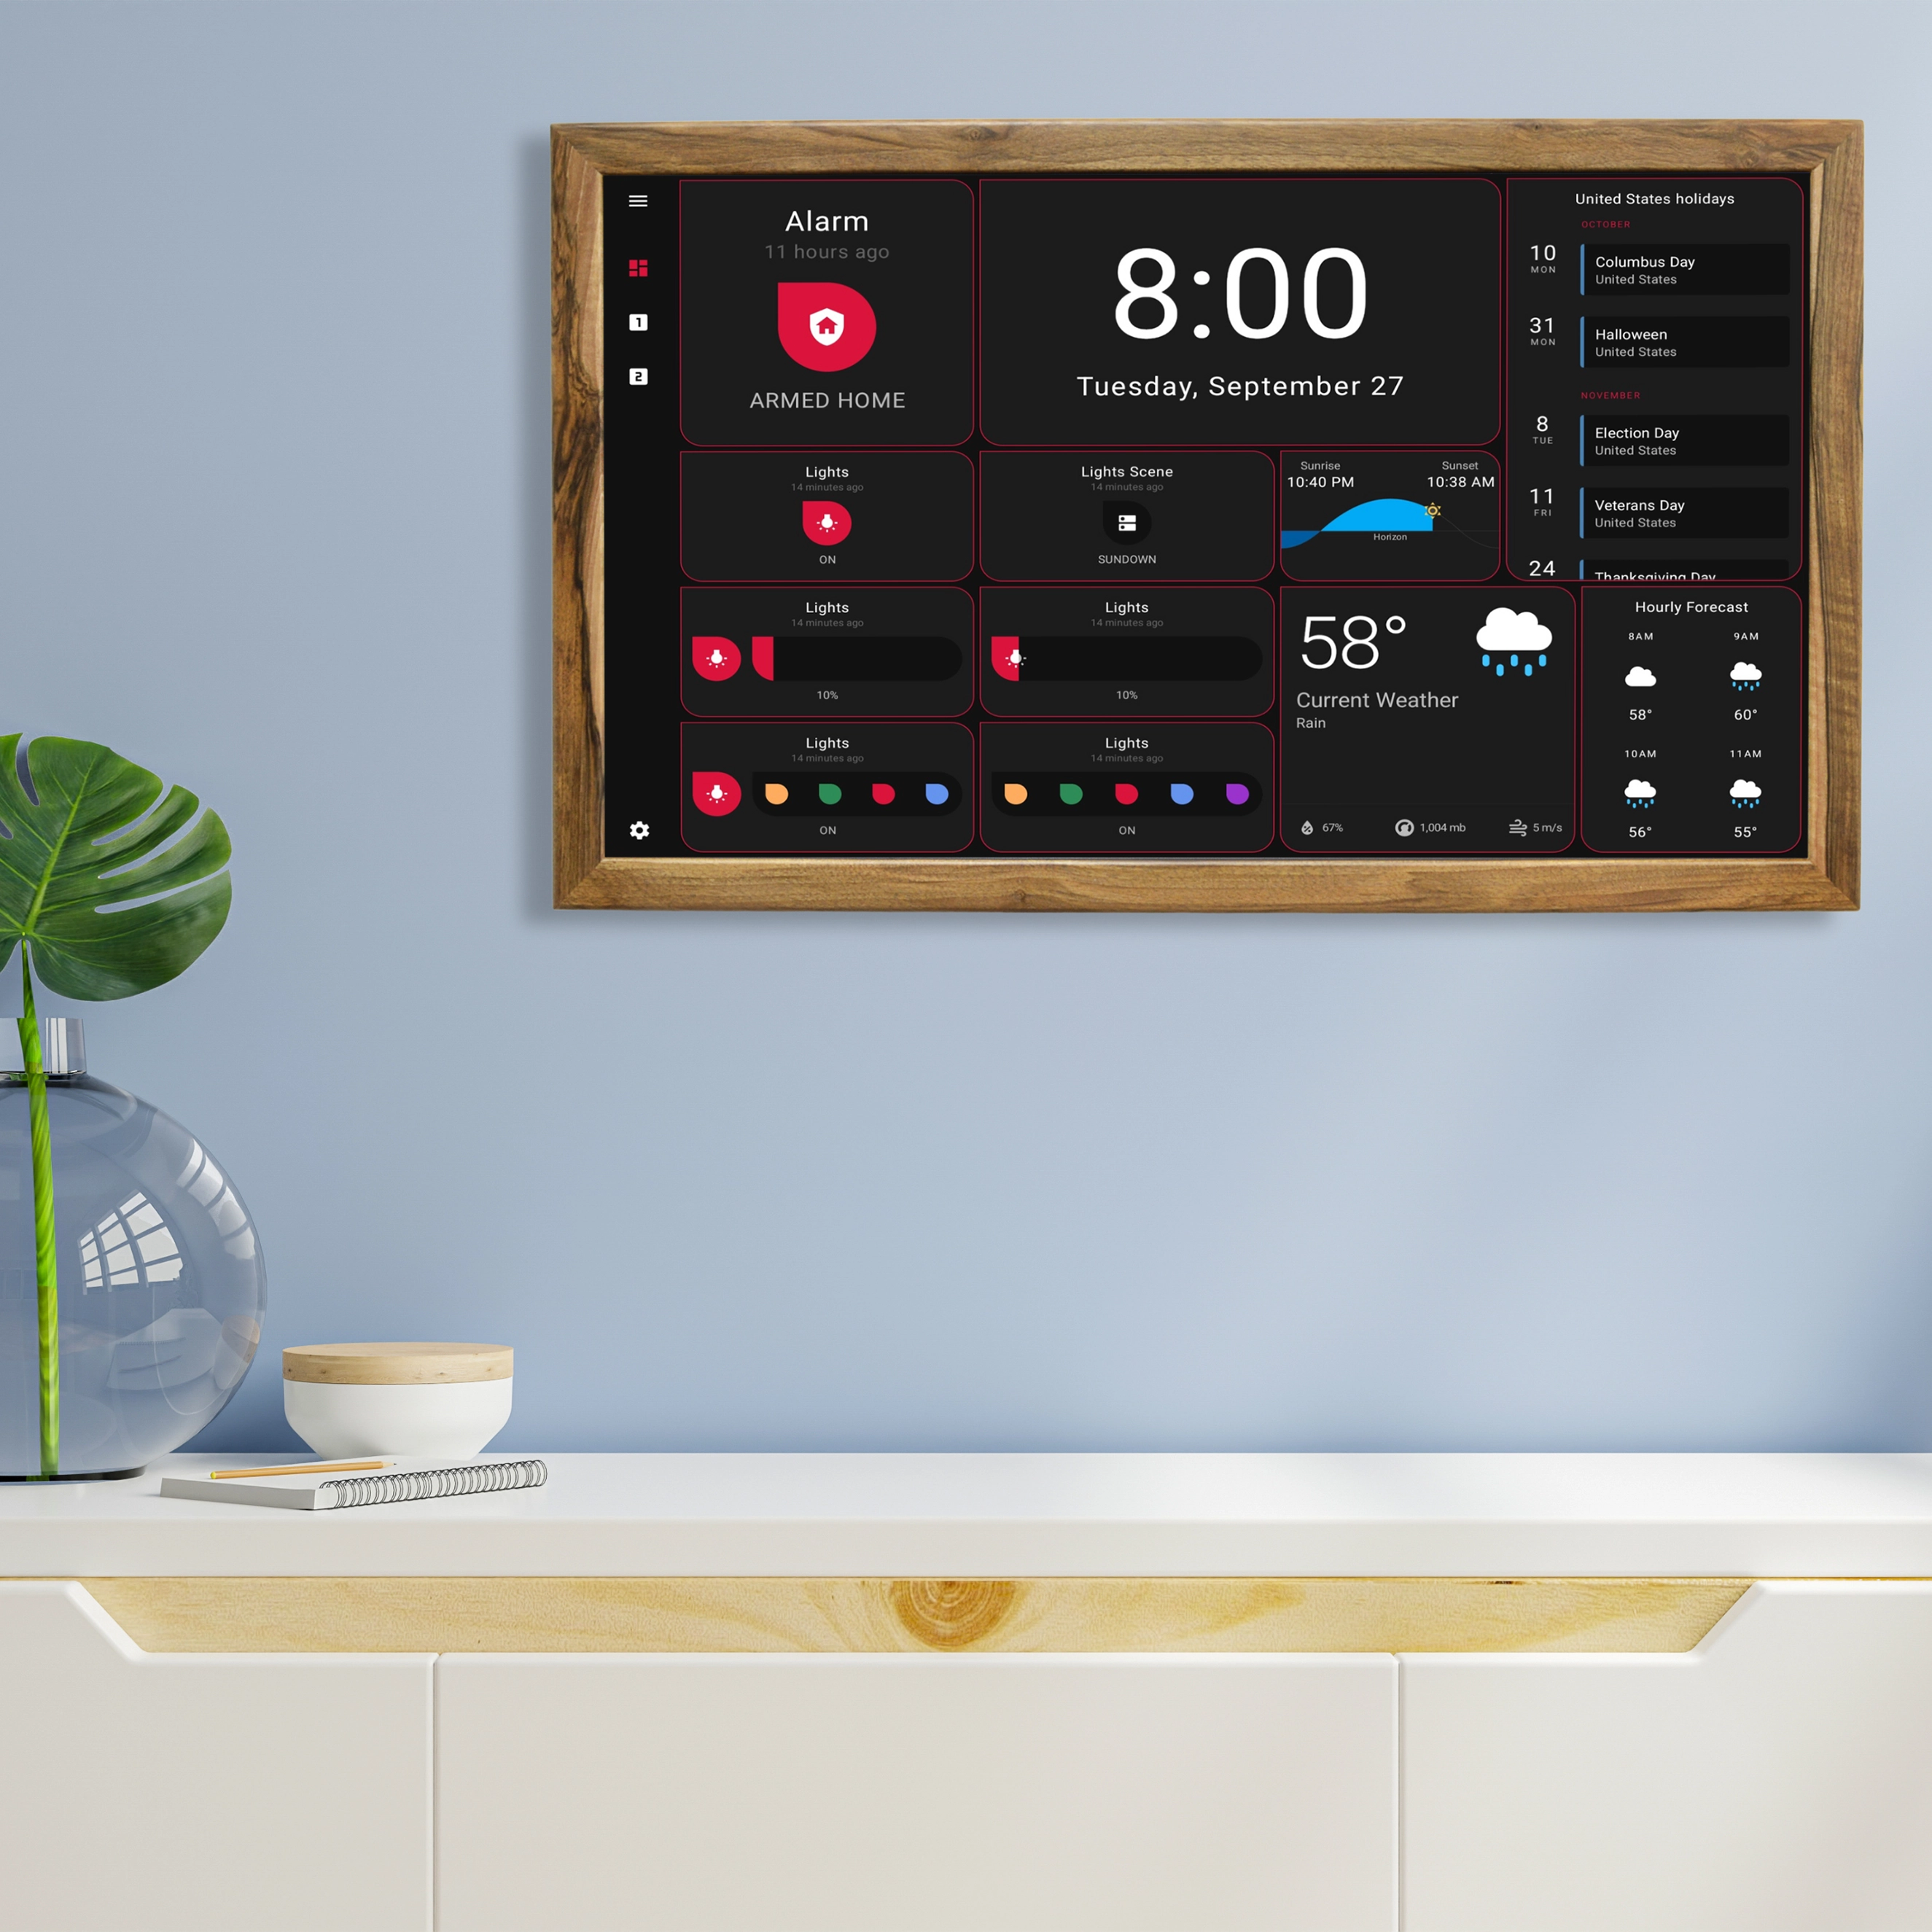
Enter the concept of a smart wall display tailored for these dashboards. The idea sounds enticing, doesn’t it? Imagine having real-time data at your fingertips—or rather, a touch away—on a sleek, 24-inch screen. The visual real estate alone is a game-changer, but when you add touchscreen functionality into the mix, you’ve got yourself a dashboard experience that’s not just interactive but intuitive.
A Deep Dive into Functionality
The Android-powered business intelligence display is more than it seems. At first glance, it’s an impressive piece of tech that grabs your attention. But what really sets it apart is how seamlessly it integrates with Power BI, making it an invaluable tool for both business owners and IT professionals.
What sets this particular smart display apart is its capacity to streamline complex data into manageable, actionable insights. No more squinting at your laptop screen trying to decipher tiny graphs or charts. The smart wall display makes every KPI and data point pop, turning them into something you can really engage with. And with customizable layouts, you can tailor the display to your specific needs and preferences.
But beyond aesthetics, it’s the interactivity that truly elevates this BI tool. By using touch capabilities, users have the power to drill down into data, reveal hidden trends, and manipulate charts in real-time. This level of engagement fosters a deeper understanding of data and ultimately drives more informed business decisions. And with the ability to collaborate and share insights in real-time, teams can work together seamlessly and efficiently. Incorporating a power BI report into this setup enhances its functionality by offering detailed and interactive dashboards that support data-driven decision making across various domains.
A Cost-Effective Solution
While the idea of a smart wall display may seem like an expensive investment, it’s actually quite cost-effective. By eliminating the need for multiple devices and software licenses, this all-in-one solution saves both time and money. And with its user-friendly interface, there’s no need for extensive training or IT support.
But perhaps the most significant savings come in the form of increased efficiency and productivity. With quick access to data and streamlined collaboration, businesses can make faster decisions and achieve greater results. And with the ability to display multiple dashboards simultaneously, users can get a comprehensive understanding of their data all in one place. This not only saves time but also ensures that all team members are on the same page and working towards the same goals. Utilizing Power BI, companies can effectively create a sales dashboard that offers interactive and comprehensive visualization tools, enabling a deep dive into sales performance metrics and insights.
A Versatile Tool
What’s really impressive about a smart wall display is how versatile it can be. It’s suitable for any industry, from healthcare to finance to retail. And with its customizable layouts and real-time interactivity, it can cater to the unique needs and demands of each organization. Power BI displays are particularly effective in tracking and analyzing financial performance, offering detailed insights into financial health and supporting strategic decision-making across various organizations.
Whether it’s displaying sales figures in a retail store or monitoring patient data in a hospital, this tool allows businesses to visualize and analyze their data in a way that best suits their specific needs. And with the option to integrate with various third-party applications, it can become an even more powerful tool for data analysis and decision-making.
Beyond Aesthetics: Practical Applications
Cosmetics aside, the practicality of having a dedicated Power BI display in your work environment is undeniable. For starters, it fosters a culture of data-driven decision making. When key metrics are constantly on display, they become a focal point of discussions, meetings, and even casual office chatter. It’s a subtle yet effective way of ensuring everyone’s eyes (and minds) are on the prize. Additionally, sales managers can leverage Power BI displays to track and analyze sales data, enhancing their ability to make informed decisions and drive team performance.
Furthermore, the touchscreen functionality is not just for show. It encourages users to interact with the data directly, drilling down into metrics, exploring trends, and even identifying outliers with a simple tap or swipe. This level of engagement can unveil insights that might have been overlooked on a traditional monitor or report, making it an invaluable asset in any data-centric organization.
And let’s not forget the power of real-time data. With live updates and automatic refreshes, a Power BI display provides up-to-the-minute information that can be crucial in making time-sensitive decisions. It eliminates the need for manual reporting or waiting for batched data to be processed, giving businesses an edge in today’s fast-paced market.
In fact, the impact of having a dedicated Power BI display goes beyond just business decisions. It can also improve overall efficiency and productivity by reducing the time spent on data analysis and reporting. With easy access to insights at any given moment, employees can focus on taking action rather than searching for information or waiting for reports to be generated.
But perhaps most importantly, a Power BI display puts data in the hands of everyone, not just those with technical skills or access to specialized tools. This democratization of data allows for a more inclusive and collaborative approach to problem-solving and decision making. It breaks down silos and empowers all team members to contribute their unique perspectives and insights, leading to better outcomes.
So while a Power BI display may seem like just a visual representation of data, it’s actually a powerful tool that can transform how organizations operate and make decisions. By embracing the interactivity, real-time updates, and accessibility of Power BI displays, businesses can gain a competitive advantage and drive meaningful change. It’s no wonder that more and more companies are adopting this technology and reaping the benefits for their bottom line. So the Power BI display is not only a valuable asset for businesses but also a game-changing tool that can drive growth and success in today’s data-driven world. It’s time to take advantage of this powerful tool and unlock the full potential of your data.
Overall, while there are certainly other options for displaying data, none can match the level of functionality, interactivity, and accessibility offered by Power BI displays. From the individual employee to the entire organization, everyone stands to benefit from this innovative technology. So why settle for outdated and inefficient methods of data analysis and reporting when you can elevate your business with Power BI displays? It’s time to embrace the power of visual data and unlock insights that will drive your organization forward. The possibilities are endless with Power BI displays – so start exploring today! Whether you’re a small startup or a large corporation, Power BI displays can revolutionize the way you work with data. So don’t wait any longer – join the growing community of businesses using Power BI and discover the true potential of your data. With this powerful tool at your disposal, the sky’s the limit for your organization’s growth and success. So take the first step towards a data-driven future and see for yourself why Power BI displays are taking the business world by storm. Let’s embrace the power of data together and drive meaningful change for your company. Keep exploring, keep analyzing, keep growing – with Power BI displays as your trusty companion every step of the way. Now is the time to elevate your business and unlock the full potential of your data. So don’t wait any longer – start using Power BI displays today and see the difference it can make for your organization.
Skepticism and Humor in the Age of Data
Now, onto the elephant in the room—how skeptical should one be about integrating such a tech piece into their data strategy? Healthy skepticism is always welcome in the tech world, especially when it comes with a side of humor. Yes, the idea of "touching" your data might sound like a gimmick at first. But once you experience the fluidity and responsiveness of interacting with a Power BI dashboard on a smart display, you'll realize it's less about the wow factor and more about deepening your comprehension of the data.
It's akin to moving from reading about gourmet dishes in a cookbook to actually tasting them. The experience is not just different; it's enriching.
In Conclusion
To sum up, the integration of Power BI dashboards on smart wall displays, especially ones that boast of size, touchscreen capabilities, and Android operation, is not just a testament to where business intelligence is heading. It’s a peek into how businesses of the future will interact with data—actively, engagingly, and with a touch of style.
The use of a global stock market dashboard, for instance, illustrates the diverse applications of Power BI in sectors like finance, offering a comprehensive tool that provides insights and facilitates better decision-making based on trade and import-export data, especially during the Covid-19 pandemic.
The marriage between sophisticated analytics and intuitive display technology is a match made in data heaven. For those pondering over the notion of incorporating such a system into their operations, contemplate no longer. This isn’t just about riding the wave of innovation; it’s about harnessing the power of data visualization in its most interactive form.
For the naysayers and skeptics, I invite you to experience it firsthand—at least before making a verdict. And for the data enthusiasts, this example of a Power BI dashboard may very well be your next big obsession.
Navigating the complex terrains of Power BI dashboards requires a guide, and perhaps this exploration into business intelligence displays has shed some light on the path ahead. Remember, in the world of data, visibility is key, but understanding? That’s the ultimate goal.


