As a daily trader, having access to real-time market data, technical analysis, news, and trading signals is crucial for making informed decisions. DAKboard allows you to create a personalized, all-in-one Tradingview dashboard, which will help you to streamline your trading process and stay ahead of the curve.
Having a dedicated Tradingview workspace with comprehensive data is extremely important for serious traders. Here are the steps for you to perform to have a useful Tradingview Dashboard.
1. Choose the Right Data Sources
Start by selecting the data sources that are most relevant to your trading style. This could include market data from exchanges, technical analysis indicators, news feeds, and social media sentiment analysis. By aggregating all this information in one place, you can quickly assess market conditions and make timely decisions.
Once you've identified and integrated your key data sources, the next step is to organize this information effectively within your dashboard. Create distinct sections for different types of data, such as market overview, individual asset performance, and news/sentiment analysis. This logical structure will help you navigate the information quickly and efficiently.
Customize your dashboard to highlight the metrics that are most crucial to your trading strategy.
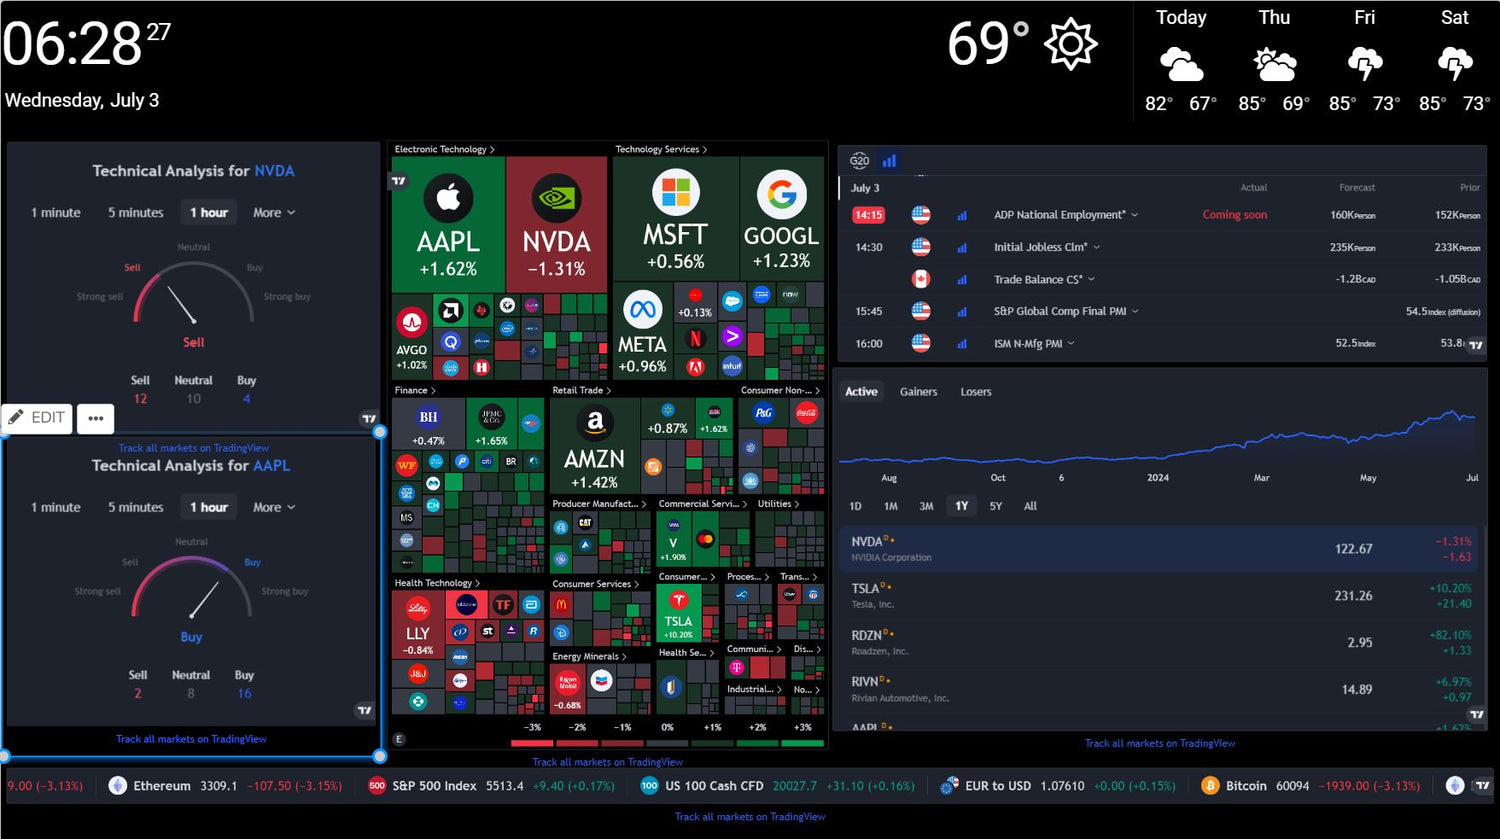
TradingView Symbol Overview
For example you can add TradingView Symbol Overview. It will allow you having latest quotes, plus a simple chart of a single symbol of your choice.

Tradingview Market Overview
Select from various Tradingview Watchlists Widget to see everything at a glance. For example, Market Overview Widget is required when you need to take a macro look at the markets.

Tradingview Stock Market

Tradingview Market Data

On the other hand, if you're more focused on fundamental analysis, you could emphasize economic indicators, earnings reports, and industry-specific news.
Implement real-time data updates to ensure you're always working with the most current information. This is particularly important for short-term traders who need to react quickly to market movements. Consider setting up alerts for significant price changes, breaking news, or when specific technical indicators reach predetermined levels.
Don't overlook the importance of visualization in your dashboard design. Use clear, easy-to-read charts and graphs to represent complex data sets. Color-coding can be an effective way to quickly convey information, such as using green for bullish signals and red for bearish ones. Remember, the goal is to absorb and interpret information at a glance.
it is crucial to regularly review and refine your dashboard based on your trading performance and changing market conditions. As you gain experience, you may find that certain data points are more valuable than others, or that you need to add new sources of information. A well-designed trading dashboard is a dynamic tool that evolves with your trading strategy and the ever-changing financial markets.
2. Customize Your Dashboard Layout
That is where DAKboard adds its advantage. You can organize your Tradingview Dashboard in a way that makes sense to you. You may want to have separate sections for market data, technical analysis charts, news updates, and trading signals. Customizing the screen layout will help you quickly locate the information you need and avoid information overload.
When organizing your dashboard, consider a hierarchical approach that allows for both broad market overview and detailed asset-specific analysis:

Market Overview Section:
- Include major index performances (e.g., S&P 500, NASDAQ, FTSE 100)
- Display key economic indicators (e.g., GDP growth, unemployment rates, inflation)
- Show sector performance heatmaps
Asset-Specific Sections:
- Create dedicated areas for each asset class you trade (stocks, forex, commodities, etc.)
- Within each asset class, have subsections for your most frequently traded instruments
Technical Analysis Hub:
- Incorporate interactive charts with customizable timeframes
- Include a panel of your preferred technical indicators (e.g., RSI, MACD, Bollinger Bands)
- Add drawing tools for trendlines, Fibonacci retracements, and other technical patterns
Fundamental Analysis Corner:
- Display earnings calendars for stocks you're monitoring
- Show key financial ratios (P/E, P/B, dividend yield) for relevant assets
- Include economic event calendars for macro traders
News and Sentiment Feed:
- Integrate real-time news tickers from reputable financial news sources
- Incorporate social media sentiment analysis for relevant assets or markets
- Add a section for analyst ratings and price targets
3. Customization Techniques
To truly tailor your dashboard to your trading style:
Use Modular Widgets:
- Implement draggable and resizable widgets for each data component
- This allows you to rearrange your dashboard on the fly based on current market focus
Implement Color-Coding:
- Assign colors to different types of data or market conditions
- For example, use green for bullish signals, red for bearish, and yellow for neutral or mixed
Set Up Personalized Alerts:
- Create a dedicated alert section that notifies you of predefined conditions
- This could include price breaches, volume spikes, or significant news events
Performance Tracking:
- Include a section that tracks your open positions and overall portfolio performance
- This helps in monitoring your trading strategy's effectiveness in real-time
4. Avoiding Information Overload
While customization is crucial, it's equally important to maintain clarity:
-
Use Tabs or Collapsible Sections:
- Group related information under expandable tabs to reduce clutter
- This allows you to focus on specific data sets when needed
-
Implement Filtering Options:
- Add filters to your news feeds and data displays
- This helps in focusing on the most relevant information for your current trading focus
-
Utilize Dynamic Scaling:
- Implement features that automatically adjust the prominence of data based on market conditions or your trading activity
- For instance, assets you trade more frequently could be displayed more prominently
-
Regular Review and Optimization:
- Periodically assess which elements of your dashboard you use most frequently
- Remove or minimize less useful components to streamline your interface
By thoughtfully organizing and customizing your trading dashboard, you create a powerful tool that aligns perfectly with your trading strategy and cognitive processes. This personalized approach not only enhances your ability to quickly interpret market conditions but also supports more informed and timely decision-making in your trading activities.
5. Utilize Technical Analysis Tools
Incorporate technical analysis tools such as moving averages, RSI, MACD, and Fibonacci retracement levels into your dashboard. These indicators can help you identify trends, support and resistance levels, and potential entry and exit points. By leveraging technical analysis, you can make more informed trading decisions.
-
Multi-Timeframe Analysis:
- Implement a system that displays technical indicators across multiple timeframes simultaneously.
- This allows you to identify both short-term trading opportunities and long-term trends.
- Example: Display 5-minute, hourly, daily, and weekly charts side by side with corresponding indicators.
-
Indicator Confluence:
- Develop algorithms that identify when multiple technical indicators align to provide stronger signals.
- Create a scoring system that rates the strength of trading signals based on the number of confirming indicators.
- Example: Assign higher probability to trades where moving averages, RSI, and MACD all suggest the same directional move.
-
Custom Indicator Development:
- Create proprietary indicators that combine multiple technical analysis concepts.
- Utilize machine learning algorithms to optimize indicator parameters based on historical data.
- Example: Develop a custom momentum indicator that incorporates volume, price action, and market breadth.
-
Fractal Analysis:
- Implement tools for identifying fractal patterns in price movements across different timeframes.
- Use these patterns to predict potential market reversals or continuations.
-
Elliott Wave Analysis:
- Integrate automated Elliott Wave counting algorithms to identify potential wave structures.
- Use this information to project possible price targets and reversal points.
-
Market Profile and Volume Profile:
- Incorporate volume profile analysis to identify key price levels where significant trading activity has occurred.
- Use market profile charts to visualize price acceptance and rejection zones.
-
Advanced Fibonacci Tools:
- Expand beyond basic retracement levels to include Fibonacci extensions, fans, and time zones.
- Implement automatic Fibonacci drawing tools that identify significant swing highs and lows.
-
Harmonic Patterns:
- Integrate pattern recognition algorithms to identify harmonic patterns such as Gartley, Butterfly, and Bat patterns.
- Use these patterns to predict potential reversal points with specific risk-reward ratios.
6. Stay Informed with News Updates
Integrate news feeds from reputable sources to stay informed about market developments, economic indicators, and geopolitical events. News updates can provide valuable insights into market sentiment and potential catalysts for price movements. By staying informed, you can adjust your trading strategy accordingly.
7. Receive Trading Signals
Consider incorporating trading signals into your Tradingview dashboard to receive buy or sell recommendations based on predefined criteria. Trading signals can help you automate certain aspects of your trading strategy and take advantage of market opportunities even when you're not actively monitoring the markets.
By creating a powerful, all-in-one trading dashboard, you can enhance your trading efficiency, make better-informed decisions, and stay ahead of the competition. Take the time to customize your dashboard to suit your trading style and preferences, and watch your trading performance improve.